
- Annual demand per person
- 2.60 gha
- Biocapacity available per person
- 1.49 gha
- Overshoot carried forward
- (1.11) gha
Special Focus
The Ecological Footprint of Youth Around the World
Demographic Realignment and Natural Capital Accounting in 2026
Sixteen years after this report first weighed the resource inheritance of the world's young people, the accounts have been restated. Some of what we forecast was wrong — and the errors point at where the real liability sits.
In Spring 2010, this report warned that today's youth would inherit a planet in ecological debt, and that the debt could not be paid off with cash. The children described in that article are now adults in their twenties and thirties. The books have been reopened.
The balance sheet today
Humanity now uses roughly 2.60 global hectares of biological capacity per person each year. The planet regenerates about 1.49. The gap is the overshoot, and it currently runs at about 1.73 Earths — consumption outpacing regeneration by some 70 per cent.
The clearest reading of that number is Earth Overshoot Day, the date the annual biological budget runs out. In 2026 it fell on 30 July, calculated by Global Footprint Network and York University, which now produces the National Footprint and Biocapacity Accounts. In 1980 it fell in late November. When the 2010 article went to press, it sat in mid-August.
Two other figures moved the wrong way. In 2010 we reported that 80 per cent of the world lived in countries running an ecological deficit; the figure now exceeds 85 per cent. And WWF's Living Planet Report 2024 found the average size of monitored wildlife populations fell 73 per cent between 1970 and 2020 — steeper than the 69 per cent reported two editions earlier.
The top of the table has changed
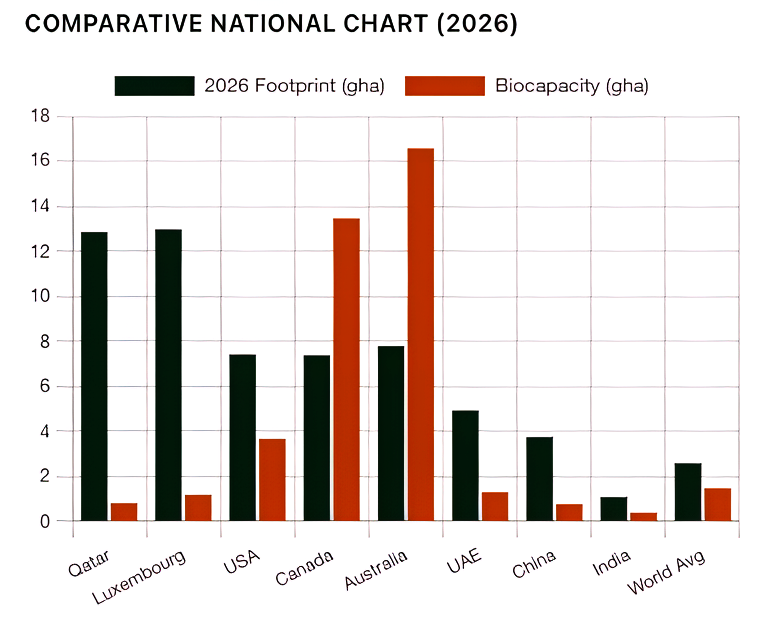
The 2010 cover listed the United Arab Emirates and the United States tied at 9.4 gha per person. Neither holds that position now. Per-capita demand has concentrated instead in small, wealthy, import-dependent states with almost no domestic biocapacity to draw against. Luxembourg now records the highest consumption per person; Qatar carries the widest gap between what it uses and what its own territory can supply.
| Country | 2010 footprint | 2026 footprint | Biocapacity | Net position |
|---|---|---|---|---|
| Luxembourg | — | 12.97 | 1.20 | (11.77) |
| Qatar | — | 12.86 | 0.83 | (12.03) |
| Australia | 7.8 | 7.80 | 16.57 | +8.77 |
| United States | 9.4 | 7.42 | 3.68 | (3.74) |
| Canada | 7.1 | 7.39 | 13.46 | +6.07 |
| United Arab Emirates | 9.4 | 4.94 | 1.32 | (3.62) |
| China | 2.1 | 3.76 | 0.79 | (2.97) |
| India | 0.8 | 1.10 | 0.40 | (0.70) |
| World average | 2.7 | 2.60 | 1.49 | (1.11) |
Deficits shown in parentheses. Net position is footprint less biocapacity, both drawn from the same edition of the National Footprint and Biocapacity Accounts. 2010 column from World Ecology Report, Vol. XXII No. 1.
The pattern is no longer rich West against developing rest. Australia and Canada consume heavily — more per person than the United States, in Australia's case — and still hold substantial ecological reserves, because their populations are small relative to vast forests, croplands and grazing land. Norway, Estonia and Brazil sit in the same creditor position. Singapore, Kuwait and the Gulf states sit at the opposite extreme, importing nearly everything they consume.
The Emirates: a real fall, and an accounting correction
The single largest reversal since 2010 is the UAE's drop from 9.4 to 4.94 gha. Part of that is policy. Under its national ecological footprint initiative, Al Basma Al Beeiya, the country audited its most carbon-intensive sectors, then commissioned the four-reactor Barakah nuclear plant and utility-scale solar at the Mohammed bin Rashid Al Maktoum Solar Park, shifting baseload power off inefficient gas turbines.
Part of it is bookkeeping. Revisions to the accounts corrected how trade flows, marine bunkering fuel and international aviation were attributed to small states — distortions that had inflated the original figure. Both explanations are true at once, and readers deserve both.
The forecast that missed
The 2010 article predicted the typical Chinese citizen would out-consume the typical American by 2040, and the typical Indian by 2080. Neither trajectory materialised.
China's per-capita footprint rose from 2.1 to 3.76 gha, then flattened at roughly half the American level rather than climbing toward 9.0. State-directed investment in mass transit, electrified high-speed rail, dense urban form and rapid renewable buildout broke the link between industrial growth and North American resource intensity.
India moved from 0.8 to about 1.10 gha — still below the global biocapacity ceiling of 1.49 gha per person. If everyone on Earth lived like the average Indian, we would use roughly three-quarters of the planet's annual budget, not five planets' worth.
Scale still tells, however. China's aggregate demand produces the largest national biocapacity deficit on Earth, exceeding 4.28 billion gha. The United States deficit exceeds 1.17 billion gha, and American consumption still implies about five Earths if universalised. The 2010 warning about American throughput has aged well. The warning about convergence has not.
The population story changed too
In 2010 we assumed the headcount would simply keep climbing. The United Nations World Population Prospects 2024 Revision ended that assumption. Global population is now projected to peak in the mid-2080s near 10.29 billion, then decline — and the probability that growth ends this century has risen to about 80 per cent, from 30 per cent a decade ago.
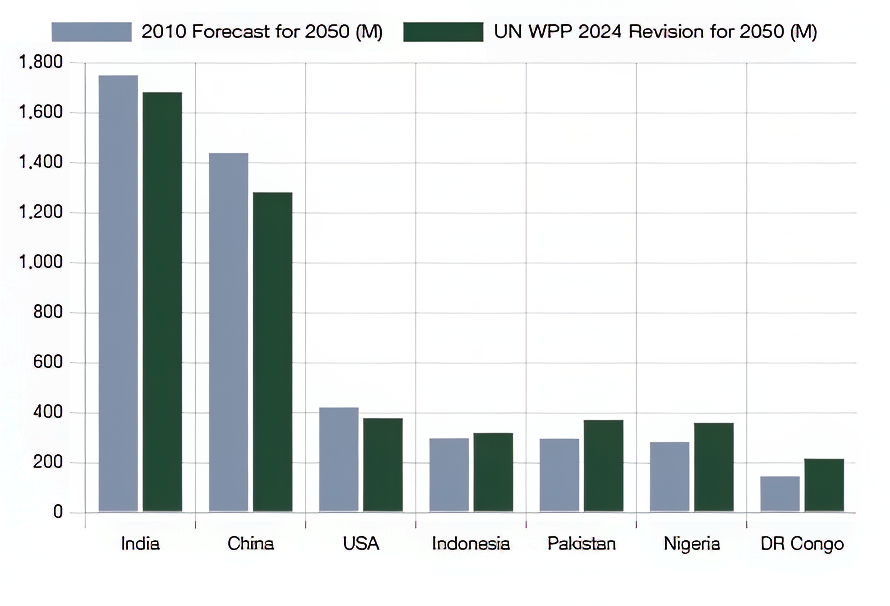
China's population has already peaked and entered structural decline. India's fertility rate has fallen to 2.0, below replacement, with its own peak expected near 1.70 billion around 2061. Where the 2010 projections understated growth is Africa and Pakistan: Nigeria is now expected to pass the United States in population, and the Democratic Republic of the Congo to reach some 215 million by 2050 against the 144 million we forecast.
Our 2010 claim that Africa's youth aged 5 to 20 would number 1.9 billion by 2035 was overstated; UN data now puts Africa's entire population at about 2.47 billion by 2050. But sub-Saharan Africa still accounts for more than half of all global population growth to 2050, and its median age remains under 19 against a global median of 31. The next generation of young people is concentrated precisely where per-capita footprints are smallest and environmental exposure is highest.
The land grab became a carbon grab
The 2010 article cited China leasing 2.8 million hectares in the Democratic Republic of the Congo for palm oil. The record deserves correcting: that deal was never executed at that scale. The DRC's Council of Ministers approved an exploratory concession of 100,000 hectares, and the project stalled on infrastructure costs and governance obstacles. Across Africa, many publicised farmland acquisitions of that era were quietly downscaled or abandoned.
The appropriation did not stop. It changed instrument. Between 2022 and 2024, Blue Carbon LLC — a UAE company under royal patronage — signed memoranda of understanding for carbon rights over roughly 1.0 million hectares in Liberia, about a tenth of the country; 7.5 million hectares in Zimbabwe, close to a fifth of its territory; 8.0 million in Tanzania; and 8.0 million in Zambia. In total, a single private company sought control of some 24 to 25 million hectares of African biocapacity, an area comparable to the United Kingdom, under terms retaining up to 70 per cent of gross carbon revenue.
This is the transaction the 2010 article described, refinanced. Instead of buying another country's cropland, you buy the legal right to its forests' capacity to absorb carbon, then sell that capacity as an offset so a debtor economy elsewhere need not cut its own emissions. In Liberia, legal reviews found the draft concessions bypassed community consent requirements under the 2018 Land Rights Act. By 2025 many of the agreements had stalled under civil-society and legal pressure. The model has not gone away.
The problem is not that young people don't care
Here the 2010 article's central moral argument needs revising. We blamed a lesson taught at the dinner table: clean your plate, children are starving. The evidence now says individual attitude is not the binding constraint.
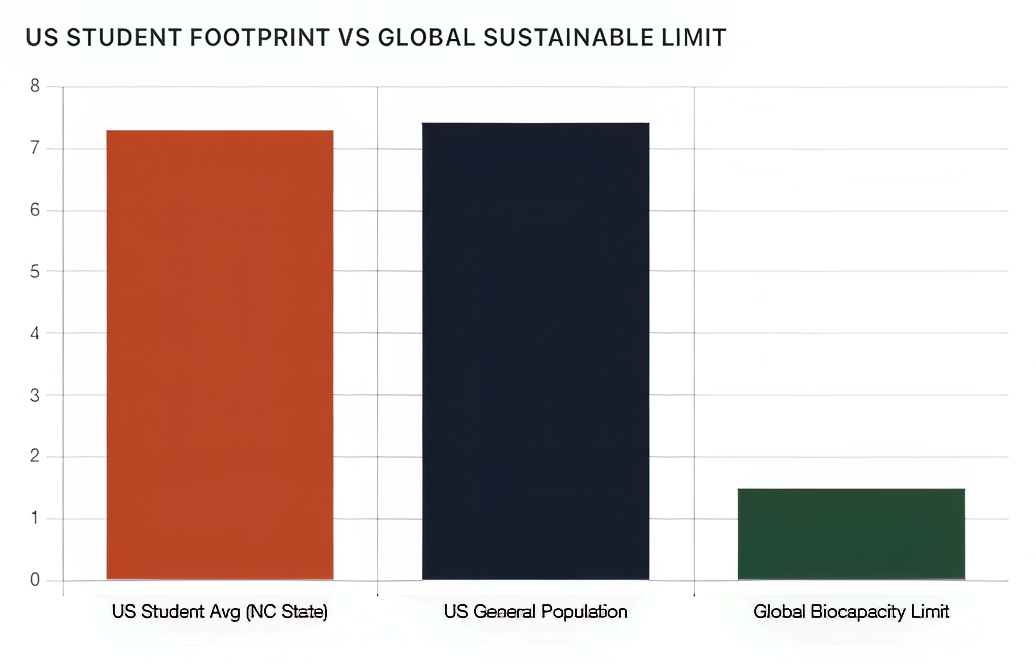
A 2024 assessment of undergraduates at North Carolina State University found an average footprint of 7.3 gha per student — 4.5 planets if universalised — despite high environmental literacy and stated climate concern. First-year students averaged 8.14 gha, seniors 6.75. Four years of environmental education moved the number, but the floor stayed at the national average.
That floor is infrastructure. If the nearest grocery store is a four-kilometre drive, you drive. If the regional grid burns gas, your lights carry that carbon whatever you believe. Food arrives through a processing, packaging and refrigeration chain you did not design. And a new line has appeared on the ledger since 2010: the energy and freshwater demand embedded in cloud computing and generative artificial intelligence, now woven through education and work.
Youth in high-income countries cannot consume their way out of a system built on depletion. Youth in sub-Saharan Africa, living under 1.2 gha, face the opposite problem — footprints too small for clean water, electricity, shelter and food security. One group needs its infrastructure rebuilt. The other needs infrastructure built at all.
A new kind of wealth, now with a ledger
In 2010 we argued that gross domestic product was an increasingly inaccurate measure, because clear-cutting a forest and draining an aquifer both register as growth while the asset written off never appears. That critique is no longer a dissent. It is becoming standard practice.
The UN Statistical Commission adopted the System of Environmental-Economic Accounting — Ecosystem Accounting in 2021, giving countries a formal method to carry ecosystem extent, condition and service flows alongside the national accounts. Gross Ecosystem Product, developed to run in parallel with GDP, prices the annual value of flood control, watershed purification, soil retention and carbon sequestration. And the 2021 Dasgupta Review, commissioned by the UK Treasury, reframed national wealth as a portfolio — produced capital, human capital and natural capital together — with the finding that accumulating the first by liquidating the third is not growth but depreciation.
This is what changes the geopolitics. Australia, Canada, Brazil, Norway and Estonia are biocapacity creditors. As carbon border adjustments take effect and offset markets face integrity tests, that position becomes a measurable economic asset rather than a talking point. Sovereign debtors running deep biocapacity deficits face the opposite: a structural exposure that tightens as physical limits bind.
The 2010 article closed by saying you cannot pay off an ecological debt with cash. That remains true. What has changed in sixteen years is that we can finally record the debt properly — and the generation now inheriting it has a right to see the books.
Sources
- Global Footprint Network and York University Ecological Footprint Initiative, National Footprint and Biocapacity Accounts, 2026 edition, under FoDaFo governance. footprintnetwork.org/resources/data
- Global Footprint Network, Earth Overshoot Day 2026 press release, 5 June 2026. overshoot.footprintnetwork.org
- WWF and Zoological Society of London, Living Planet Report 2024.
- United Nations Department of Economic and Social Affairs, Population Division, World Population Prospects 2024: Summary of Results.
- United Nations Statistical Commission, System of Environmental-Economic Accounting — Ecosystem Accounting, 2021.
- HM Treasury, The Economics of Biodiversity: The Dasgupta Review, 2021.
- European Environment Agency, Ecological Footprint of European Countries.
- Land Matrix Initiative, transnational land acquisition database.
- Source Material, CorpWatch and The Breakthrough Institute, reporting on Blue Carbon LLC concessions in Liberia, Zimbabwe, Tanzania and Zambia, 2023–2025.
- "University Students' Ecological Footprint and Lifestyle Changes," Education Sciences (MDPI), 2025.
- Williamson, J., "The Ecological Footprint of Youth Around the World," World Ecology Report, Vol. XXII No. 1, Spring 2010.